
What is P/E? Does a low P/E stock really mean it's cheap?
A stock at P/E 12 versus another at 35 may tempt us to call the first cheaper. The figures alone do not say whether earnings are growing, shrinking, or boosted by special items. Start by asking, “What kind of earnings is this price being compared with?”
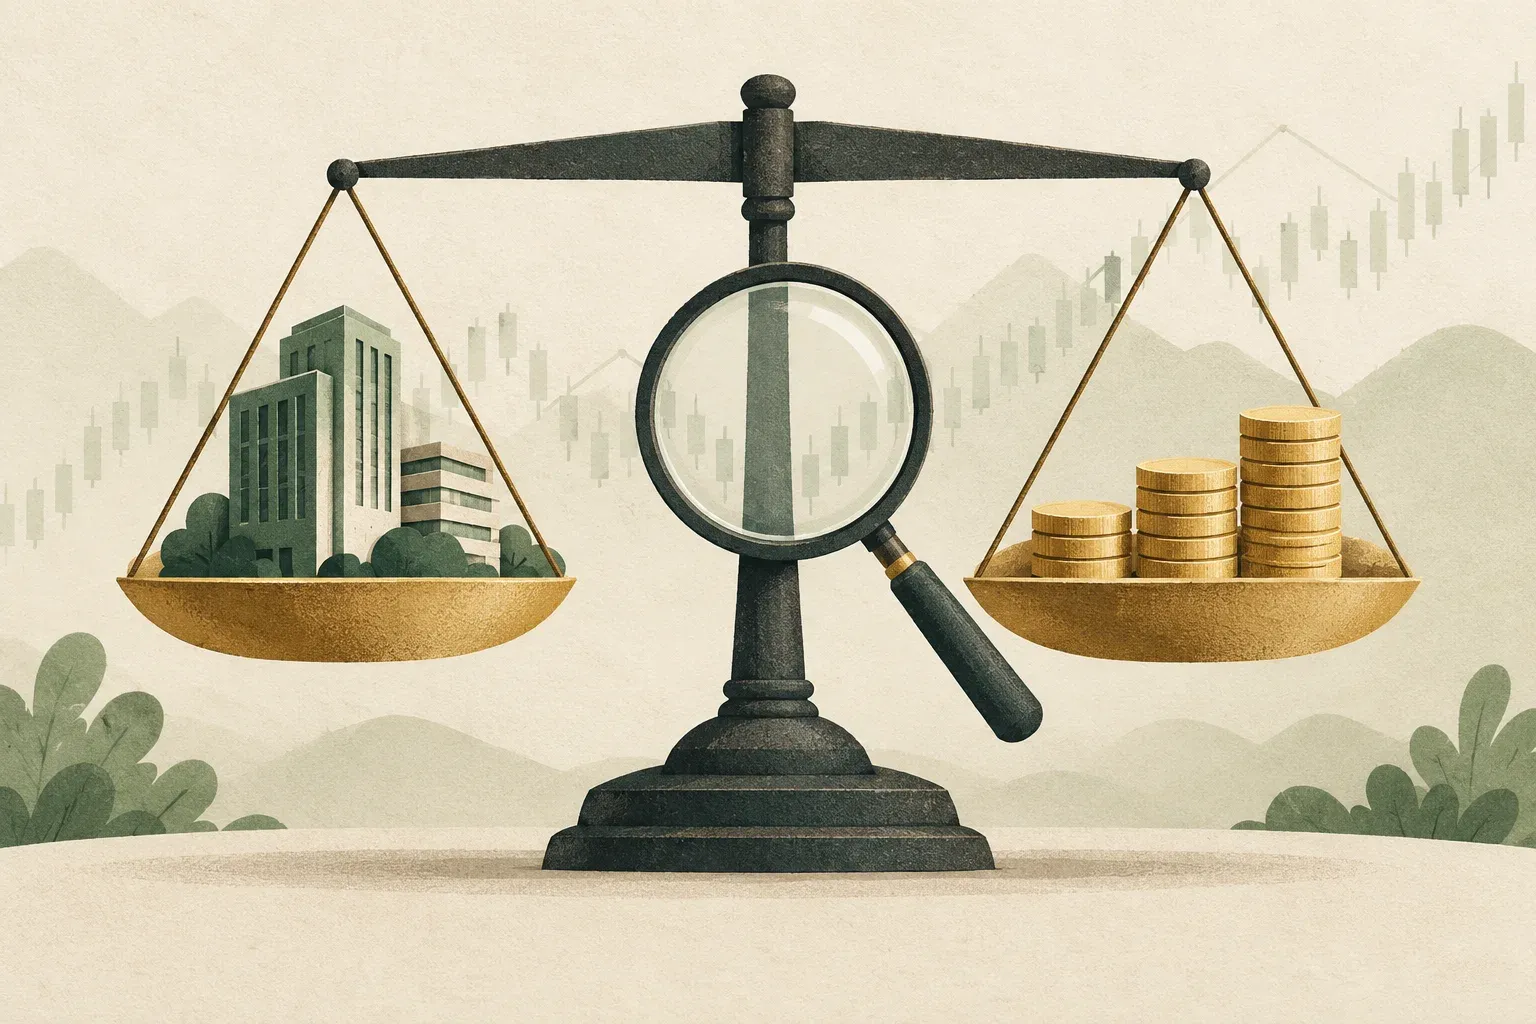
P/E tells you how many times the stock's price is its earnings.
P/E stands for Price-to-Earnings Ratio. The basic formula is Stock price divided by earnings per share, or EPS. With a US$100 price and US$5 EPS, P/E is 20×: investors pay 20 units of price per unit of earnings on that stated basis.
Do not immediately conclude “20 years to recover the investment”: future earnings may rise, fall, or fluctuate, and companies may reinvest, repurchase shares, pay dividends, or retain cash. P/E is a comparison ratio, not a payback countdown.
Trailing P/E and Forward P/E use different sets of profits.
Trailing P/E Uses realized earnings, usually trailing 12 months. These reflect actual results but may lag rapidly changing businesses.
Forward P/E Uses forecast earnings, such as the next 12 months, reflecting expectations more directly but depending on estimates. Unexpected sales, margins, or economic conditions change the denominator, making a previously modest P/E suddenly higher.
Before comparing two websites, verify the same P/E type and period. Otherwise you may compare one company's historical earnings with another's forecast earnings unknowingly.
Why a low P/E may not necessarily mean a cheap stock
Think of two stores. The first store had stable profits and customers came back to buy again. As for the second shop, profits soared because they sold a large chunk of land just once. If using last year's profits The second store may have an attractively lower P/E. But that profit may not be repeated next year.
- Profits are falling: Share prices may fall before trailing EPS declines, temporarily making P/E look low
- Profit has special items: Asset sales or tax benefits may push up profits in a single year.
- The business has high debt or risk: The market may assign a low multiple because it doubts earnings are sustainable.
- In an upswing of the cycle: Some commodity companies see their lowest P/Es when earnings are near the top of the cycle.
Try recalculating when a portion of the profit is not repeated.
Suppose a US$100 stock has US$5 EPS, comprising US$2 from ongoing operations and US$3 from a hypothetical one-time gain. Total EPS gives P/E of 20×, while the US$2 base gives 50× at the same price. Different earnings bases produce very different ratios.
50 times is only an experiment with different assumptions, not automatically a more accurate P/E or company-endorsed adjusted EPS. Before excluding any item, read statements and notes to determine its effect on net income per share, whether it can recur, and whether taxes and share counts are accounted for. Do not subtract an entire asset-sale amount directly from EPS. Then examine earnings quality further in FCF vs. EPS and P/E article
Does a high P/E mean expensive?
A high P/E means investors pay more relative to current earnings. Reasons may include expected growth, steady revenue, low capital needs, or durable competitive advantages. Higher expectations also make prices more sensitive to earnings disappointments.
A stock at 35 times earnings may therefore be more reasonably priced than one at 12 times if earnings growth and quality differ substantially. When comparing them, ask: Are the growth and certainty worth the price paid?
Loss-making companies will not have a meaningful P/E.
With negative EPS, dividing price by negative earnings does not clarify value. Websites therefore often show P/E as a dash or N/A. You might instead examine revenue, gross margin, cash flow, cash balances, debt, and a path to profitability, but each metric has limitations. Replacing P/E with price-to-sales does not automatically make the stock cheap.
Use P/E without relying on a single number
- Check whether P/E is trailing or forward and EPS is GAAP or adjusted
- Compare companies with similar business models and cycle stages
- Compare with the company's historical P/E range, considering changes in quality and growth
- Examine the sources of earnings, margins, debt, cash flow, and increases or decreases in share count
- Make multiple assumptions instead of using just one target P/E.
P/E is an accessible starting point for asking questions. Sound decisions also consider earnings quality, growth, financial position, and a price allowing for mistakes.
Sources
This article provides general knowledge. It is not a recommendation to buy or sell securities. Example numbers are simplified to explain the concept.