
Stock Valuation: FCF vs. EPS and P/E
FCF measures cash generation, while EPS measures earnings per share and P/E compares price with earnings. Valuation models use these figures differently and remain sensitive to their assumptions.

Price, value, and financial statement figures are different things
Price is what the market trades at; estimated value comes from a model and its assumptions. FCF and EPS provide inputs. Displaying an estimate to two decimals does not make its assumptions more reliable.
KrobClick's FCF per share and EPS/P/E tabs use simplified educational models: project per-share figures for 5 years, estimate a future price, then discount it using Required return The Reverse DCF tab uses annual cash flows and terminal value to solve for the growth rate that explains the current price. The three tabs therefore use different formulas, and do not provide a complete business valuation adjusting for capital structure, debt, and all other assets.
The FCF method: start with free cash flow
Free cash flow describes cash remaining after operating cash generation and investment to maintain or expand the business. Definitions differ: FCFF is cash flow to the firm before allocation to creditors and shareholders, while FCFE is cash flow to equity holders. Check the source’s definition and consistency before using FCF per share.
This website's simplified model grows current FCF per share at an assumed rate, then divides by a target FCF yield to estimate future value. This is a simple approximation, not a full DCF.
Example: FCF per share 5 dollars growing 10% per year for 5 years becomes approximately 8.05 dollars. Using the target FCF Yield 5%, the hypothetical future price is 8.05 ÷ 0.05 or approximately 161 dollars.
This method is useful for businesses with consistent cash generation and a meaningful FCF definition. Watch for volatile working capital, deferrable capital spending, acquisitions, and stock-based compensation. Fast-growing businesses may have low FCF because of heavy investment; this does not necessarily mean they lack value.
The EPS and P/E approach: start with earnings and a multiple
This method estimates future EPS and multiplies it by the P/E the market is expected to assign. Same set of examples: EPS 5 dollars grows 10% per year for 5 years to approximately 8.05 dollars. Using a target P/E of 20 times, the future price will be approximately 161 dollars.
EPS-based valuation is easy to interpret and compare with similar companies, but accounting items can make earnings differ from cash. Interest rates, business quality, and market expectations can also change the appropriate P/E multiple.
Why two methods can agree without proving correctness
In this example, 5% FCF yield mathematically corresponds to a 20× multiple, producing similar endpoints with equal starting FCF/EPS and growth. Actual earnings and cash often diverge, and appropriate P/E may differ from inverse FCF yield.
Similar model outputs warrant further investigation, not confidence that either estimate is correct. Both may depend on the same fragile assumption, such as 10% annual growth.
When to value a company using FCF or P/E
Try keeping the fifth year FCF at 5 × 1.10^5 = 8.05255 dollars per share Then change only the target FCF Yield to 4%, 5% and 6%. The future prices will be approximately 201.31, 161.05 and 134.21 dollars respectively. It is calculated from the unrounded value and displayed in two places. All three figures have not been discounted to the present. Changing the target yield is not changing the desired growth rate or return. And there is no case of confirmation of the actual trading price in the future.
- FCF: Worth studying when business cash flow is reasonably predictable and capital expenditure reasonably reflects its economics
- EPS and P/E: Easy to use for profitable businesses with comparables, but distinguish normal earnings from one-time items
- Use both: Use differences to investigate profit versus cash, rather than averaging two estimates and assuming accuracy
Financial institutions, cyclical businesses, and loss-making companies may require other metrics or models. Applying one formula to every company can conceal important economic differences.
Use reverse DCF to ask what growth the current price requires
FCF Yield and P/E start with assumptions to calculate the price, while Reverse DCF starts with the current price. Then find the FCF growth rate that makes the present value of the annual cash and Terminal Value combined equal to that price under the selected Discount Rate and long-term growth. The result is therefore an expectation that the model can interpret. It is not a prediction that the company will grow accordingly.
- Open Stock valuation tool Select Reverse DCF and ensure price and FCF per share use the same currency
- Enter the current stock price and current FCF per share. Both fields must be greater than 0. Do not use company-wide profits instead of FCF per share.
- Choose a whole-number forecast period; the tool accepts 1-10 years. Enter Discount Rate and Terminal Growth as annual percentages.
- Keep Discount Rate above Terminal Growth. The tool will not calculate when they are equal or Discount Rate is lower.
- Read the calculated growth rate, reverse-calculated value, terminal-value share, and annual FCF table. Results update as inputs change, without a Calculate button.
Practice with hypothetical inputs: share price US$100, FCF per share US$5, five years, discount rate 10%, and terminal growth 3%. Record implied growth and terminal-value share, then raise only the discount rate to 12%. Required growth should rise. Restore 10% and verify the original result. These are practice assumptions, not recommendations for an actual stock.
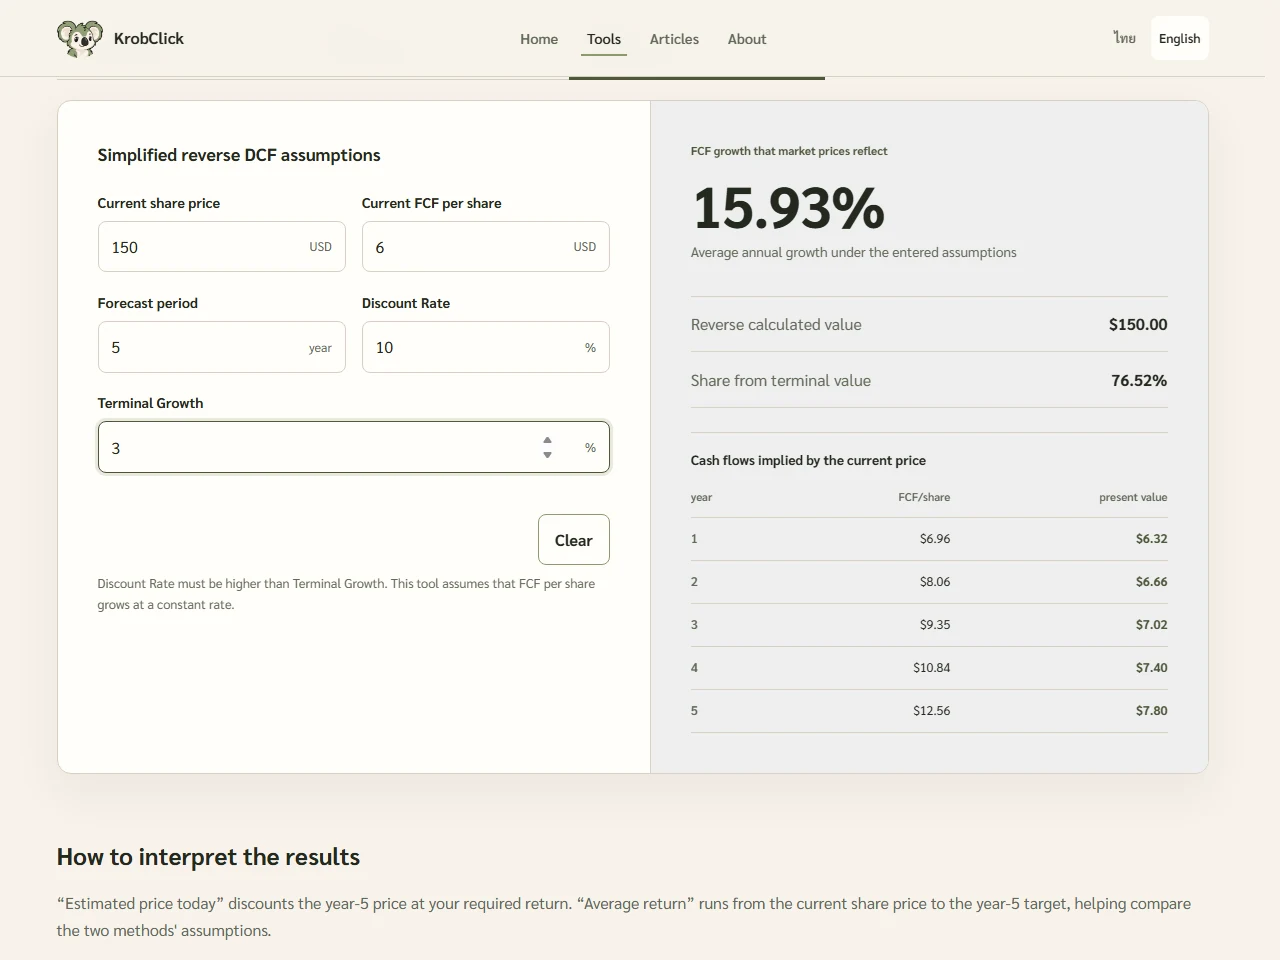
Terminal value represents cash flows beyond the forecast period, not cash received immediately. A high share means valuation depends heavily on terminal assumptions. Change Discount Rate and Terminal Growth individually to test sensitivity, following Aswath Damodaran's Terminal Value Explanation at NYU Stern Do not choose long-term growth solely to reach your desired price
The code searches growth rates from -99% to 300%. No result produces an error, not a zero valuation. Do not manipulate inputs merely to pass. Negative FCF or future equity issuance needs further analysis; the tool does not automatically estimate shares, debt, or excess cash.
Test valuation assumptions before relying on the result
- Use multi-year averages and investigate unusual years
- Compare at least three cases: conservative, baseline, and favorable.
- Lower the growth rate or adjust the multiplier to see what value is most sensitive to.
- Discount using a required return appropriate to the risk.
- Allow for Margin of Safety for factors the model does not capture
If a small change in assumed growth causes a large change in estimated value, the model is highly sensitive to that assumption. It does not establish that the investment opportunity has been valued accurately.
Sources
- Stock Exchange of Thailand: Formula summaries and calculation techniques for equity investment analysis
- Stock Exchange of Thailand: Fundamental Securities Analysis
- NYU Stern / Aswath Damodaran: Estimating Terminal Value
- KrobClick: Stock valuation and Reverse DCF tool
These simplified educational models are not trading advice or valuations of specific stocks. Actual data may involve adjustments, taxes, debt, and other risks outside these formulas. Tool steps were added after reviewing code version 06c6444 on October 21, 2026 and browser checks with hypothetical data, without actual accounts or transactions.