
What is CAGR? Why can average returns be misleading?
The first year's return is negative 50% and the following year's is positive 50% with an average of zero. But the money did not return to the same amount as before. This difference is why we need to separate simple average from compounded return, or CAGR, before comparing investments over multiple years.
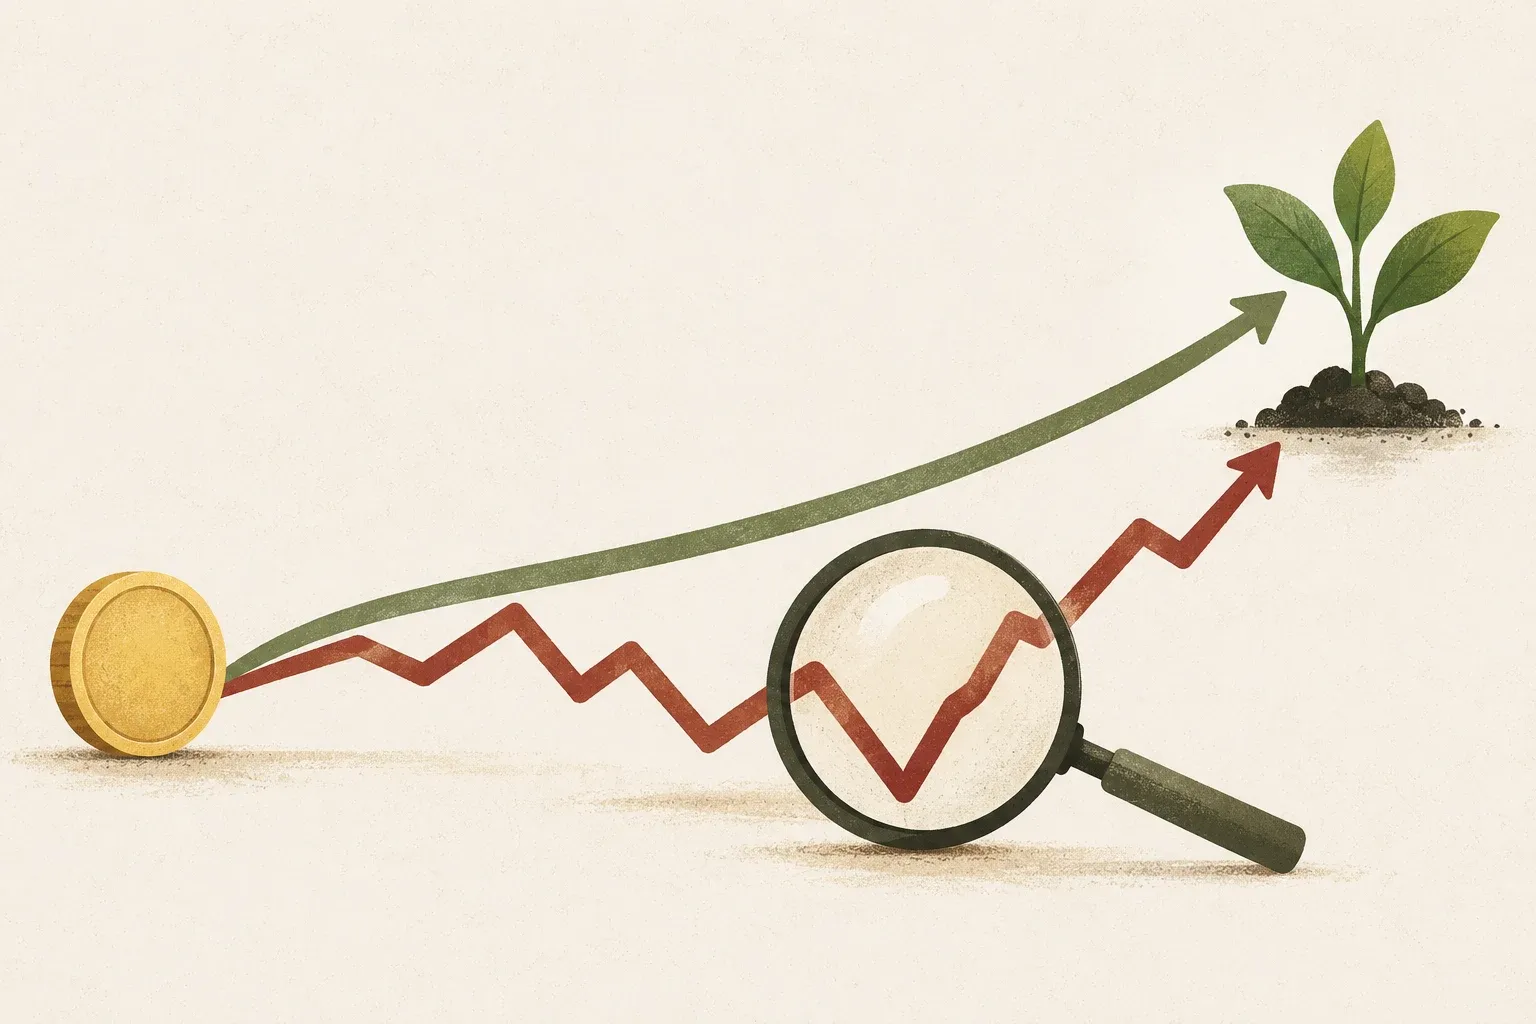
CAGR is a hypothetical constant rate connecting the starting principal to the ending amount
CAGR stands for Compound Annual Growth Rate. It answers: “What constant annual percentage growth would turn the initial value into the ending value over the specified time?”
Formula: CAGR = (Ending value ÷ Initial value)1 ÷ number of years − 1
Hypothetical example: 100 baht increases to 121 baht in two years, CAGR = (121 ÷ 100)1/2 − 1 = 10% per year, because 100 × 1.10 × 1.10 equals 121 baht
CAGR does not mean the investment actually returned 10% every year. It expresses the result over several years as one constant compound rate, making periods of different lengths easier to compare.
Why a 50% gain does not reverse a 50% loss
Suppose you start with 100 baht and lose 50% in the first year, leaving 50 baht. A 50% return on the remaining money the next year adds 25 baht, ending at 75 baht rather than 100 baht.
- Arithmetic mean: (−50% + 50%) ÷ 2 = 0%
- Total returns: (75 ÷ 100) − 1 = −25%
- CAGR: (75 ÷ 100)1/2 − 1 ≈ −13.40% per year
The arithmetic average treats each period’s percentage return equally, regardless of the changing balance. CAGR connects the starting and ending values and therefore reflects compounding over the period.
Losses require more profits to come back to where they were before.
| Loss on principal | Money remaining from 100 baht | The profit that must be obtained from the remaining money to return to 100 baht. |
|---|---|---|
| 10% | 90 Baht | About 11.11% |
| 20% | 80 Baht | 25% |
| 50% | 50 baht | 100% |
| 75% | 25 baht | 300% |
The table illustrates percentage asymmetry, not a market forecast. After a loss, recovery starts from a smaller base and requires a larger percentage gain to restore the original amount.
How is CAGR different from other return figures?
| numbers | Answer questions | Suitable when | Important limitations |
|---|---|---|---|
| Total return | What percentage did the money increase or decrease over the entire period? | Want to see results from beginning to end without comparing the length of time periods. | A 2-year total return cannot be compared directly with a 10-year total return. |
| arithmetic mean | What is the average of the return figures for each period? | Summarize certain types of periodic datasets | Does not reflect compounding and may overstate benefits |
| CAGR or compound annual return | What constant annual rate links the starting and ending values? | No contributions or withdrawals during the period, with a need to compare several years | Hide the path and fluctuations along the way |
| Returns that take cash flow into account, such as IRR/XIRR | What is the effect of the amount and time of adding or withdrawing money? | Actual portfolios have cash flows on different dates | Sensitive to cash flows and may require calculation tools |
Interim contributions and withdrawals need cash-flow-aware measures
Reverse the no-cash-flow sequence: 100 baht rises 50% to 150, then falls 50% to 75. Ending value and CAGR match the fall-then-rise case, but the path differs. Interim withdrawals can change investor outcomes. Record cash-flow dates and amounts before choosing metrics; one CAGR cannot represent every portfolio experience.
Suppose a portfolio grows from 100,000 to 160,000 baht in three years, but the investor contributes another 40,000 baht during that period. Immediately calculating CAGR from 100,000 and 160,000 treats the added contributions as though they were investment returns.
With inflows and outflows, distinguish at least two questions:
- How the strategy or asset performed: Often, returns are used that remove the effects of the size and timing of cash flows.
- How our actual money grows: The amount and date of deposits or withdrawals must be taken into account, such as money-weighted return or XIRR calculations.
DCA should therefore not be evaluated based on the initial and final two amounts only. If you want to test the results of your monthly investment, duration, and hypothetical returns, use DCA calculator then compare multiple scenarios rather than relying on one result
The same CAGR can have very different risks.
Two portfolios can have the same starting and ending values and CAGR but very different paths. CAGR does not reveal volatility, maximum drawdown, recovery time, or the liquidity pressures an investor experienced.
When evaluating performance, view CAGR alongside at least:
- Annual returns or a portfolio-value chart over the period
- Maximum loss from highest point to lowest point
- Volatility and recovery period
- Are fees, taxes, dividends and exchange rates included?
- Reference index suitable for the same asset and time period
Check the calculation method before believing the word "per year".
Labels such as “average annual return” and “annualized return” may use different methods. Before comparing them, ask:
- Do the start and end periods match?
- Are dividends included and reinvested?
- Have fees, taxes, and trading costs been deducted?
- Were there contributions or withdrawals during the period, and how were they handled?
- Is it an actual historical result, target, or simulation assumption?
Investor.gov cautions that performance claims require examining calculation methods, dividends, taxes, and market conditions. Returns exposed to market risk cannot be guaranteed.
Use CAGR as a ruler, not the whole map
When there are no intervening cash flows, CAGR expresses several years of change as an annual compound rate. You still need to examine losses along the way and whether returns were consistent. Before using the figure to make a decision, check the calculation method, assess risk, and choose a measure suited to the question you need to answer.
Sources
- Investor.gov: Compound Annual Growth Rate (CAGR)
- FINRA: How Are Your Investments Doing? Returns, Explained
- Investor.gov: Investor Bulletin—Performance Claims
This article provides general knowledge. All numbers are hypothetical examples. It is not a return prediction or trading recommendation. For actual calculations, check whether dividends, fees, taxes, and intervening cash flows are included.